October 28 update: the deadline to submit a draft map has passed. Thanks to those who submitted maps, and please take a minute to look at the draft maps and let the Council know which you prefer.
Districting is different than most issues that come before the City Council. Instead of being limited to saying you support or oppose a City-prepared ordinance or resolution, you can draw a map yourself!
There are a variety of map-drawing tools available below:
- Paper-only maps
- Paper maps with a Microsoft Excel Supplement Kit
- A powerful, but also complicated, online map-drawing tool
You can draw the borders of your neighborhood and indicate whether you want it united in one district or if you want your neighborhood to have multiple Councilmembers representing it. Or draw a proposed Council district. Or sketch an entire citywide map of 5 Council districts.
Draw whatever you want the Council to consider and submit it to Roseville@NDCresearch.com.
Please submit your initial map(s) no later than Friday, October 11!
After it is submitted, the City’s demographic consultants will generate the population and other demographic details for your proposed map.
After you draw your proposed plan(s), be sure to compare them with the other maps posted to the Draft Maps page.
Paper-Only Maps
Draw your proposed map on any city map, or click here to use the PDF map developed for this project. Instructions, including how to submit your proposed map of districts, are on the one page PDF file.
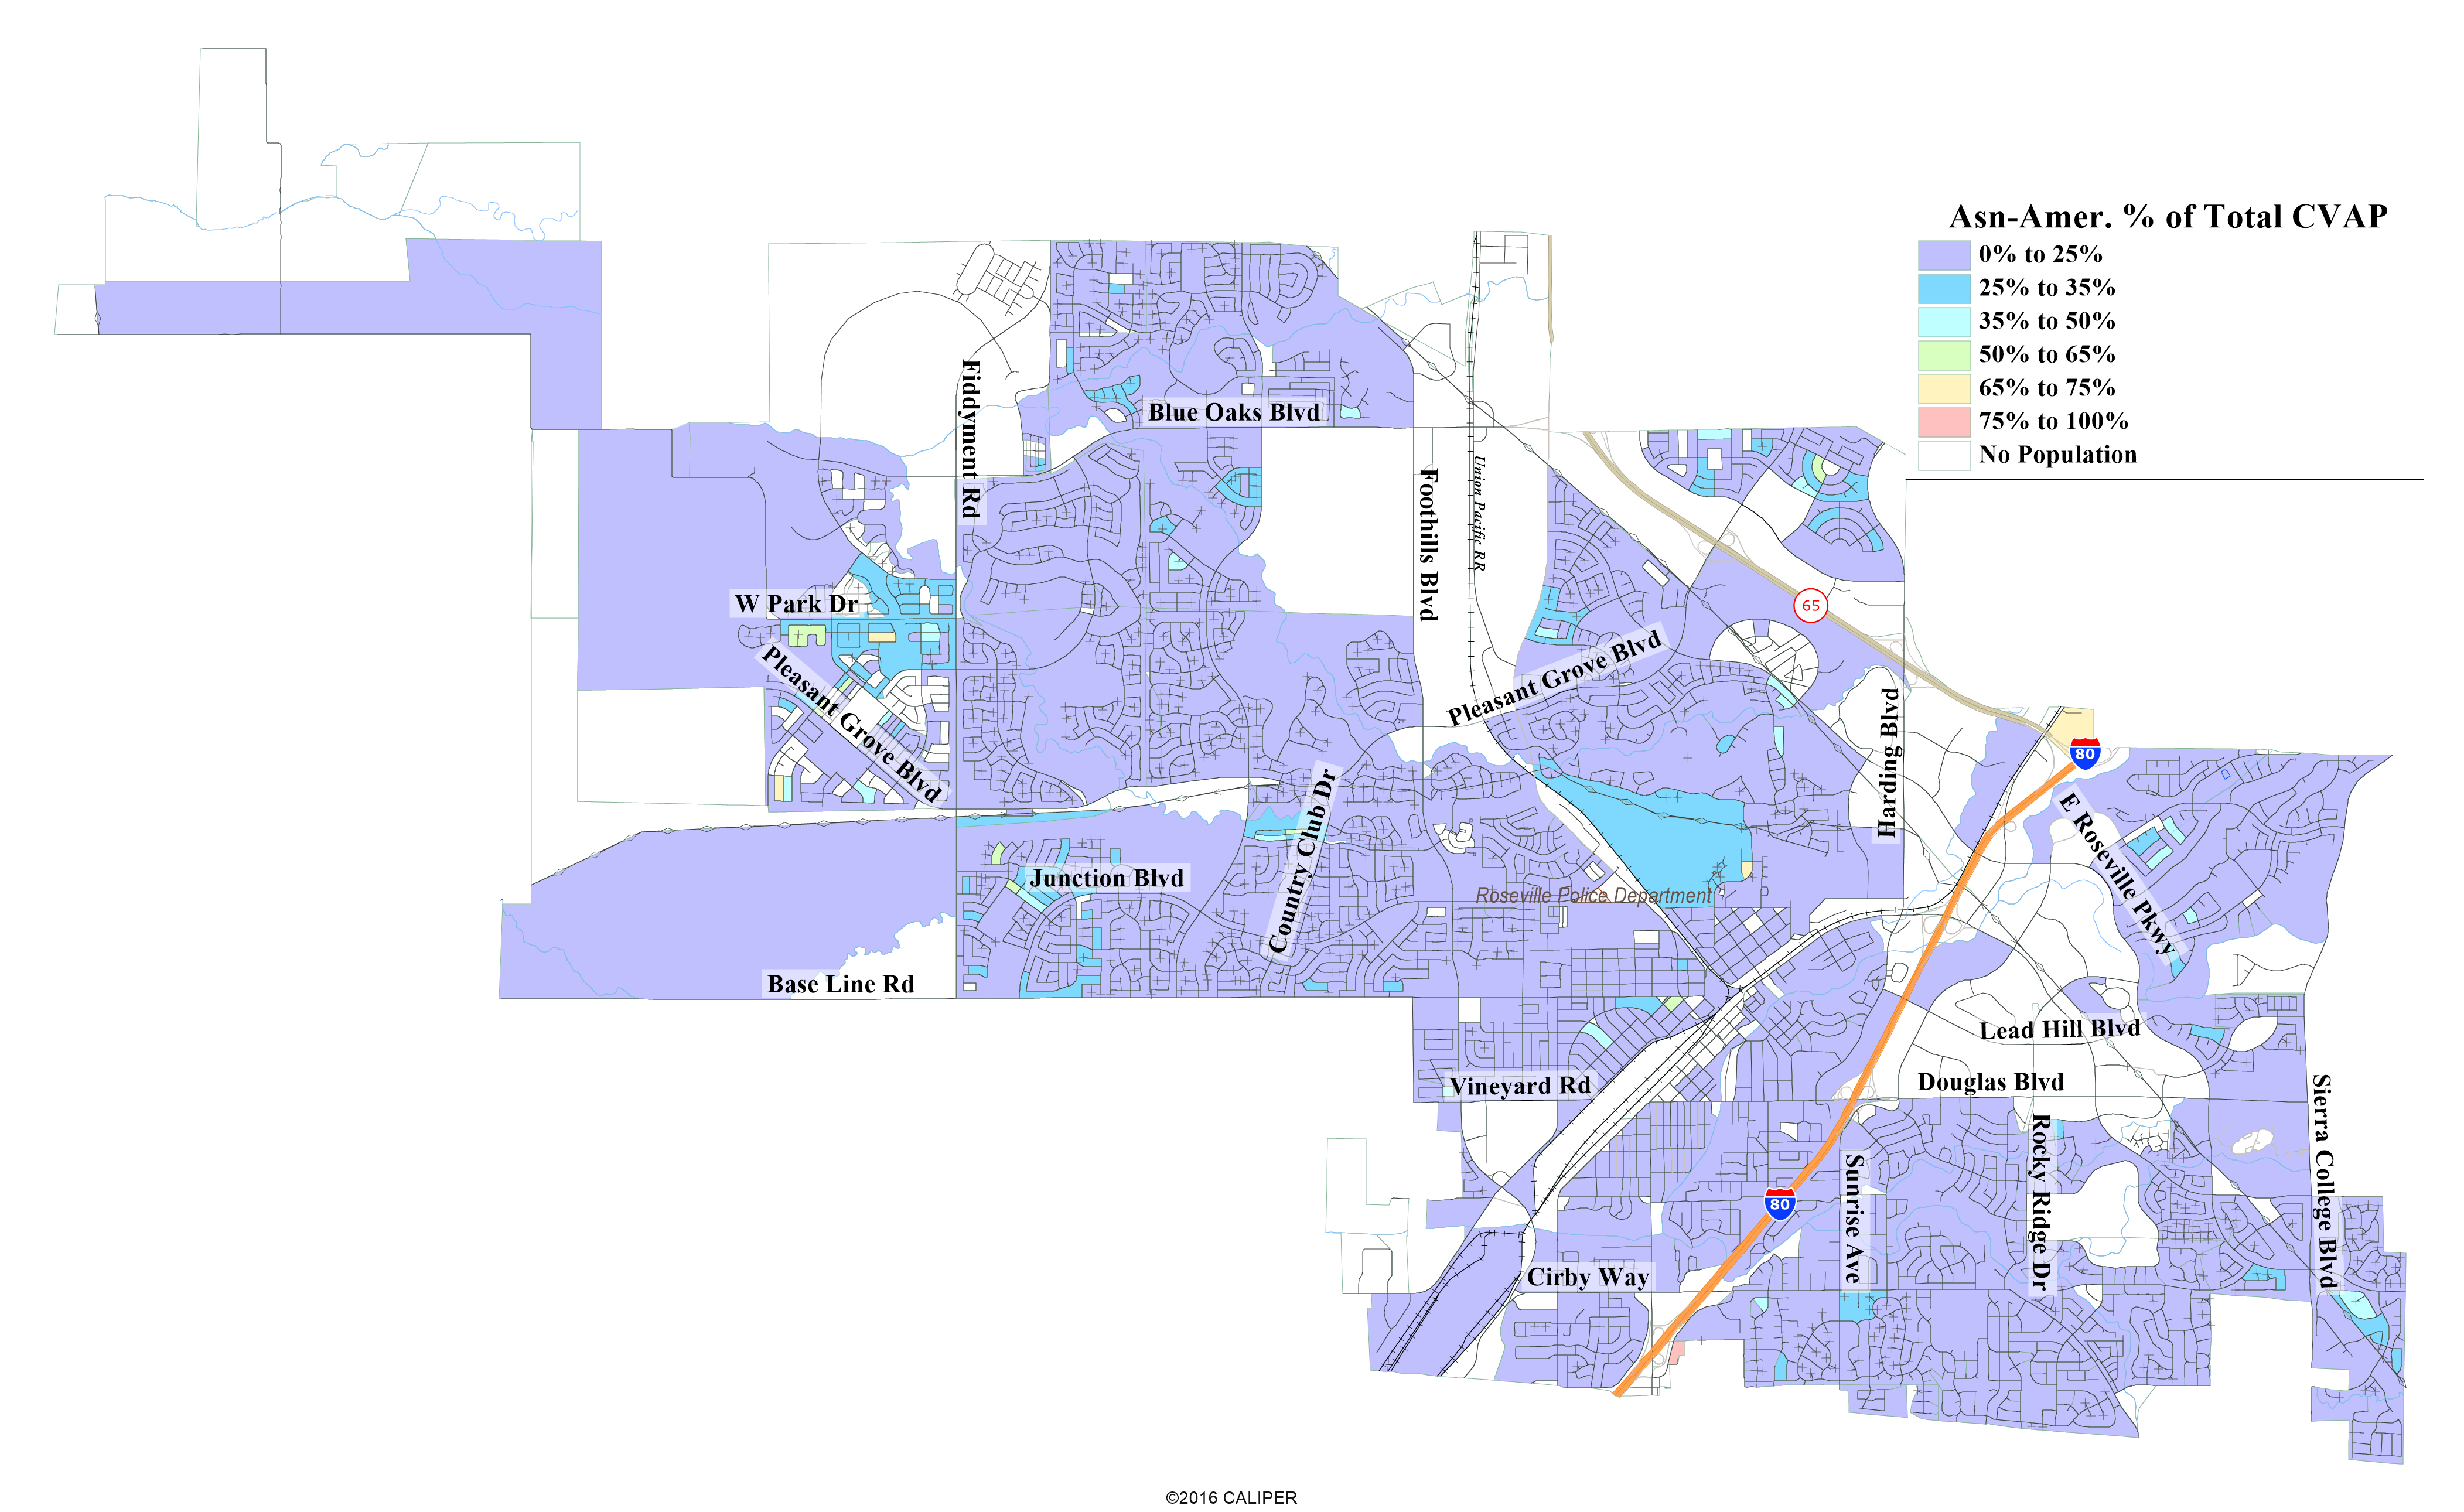
Additional Demographic Data:
- Asian-American percentage of total Citizens of Voting Age Population (CVAP) (data estimate by Census Block)
- Latino percentage of total Citizens of Voting Age Population (CVAP) (data estimate by Census Block)
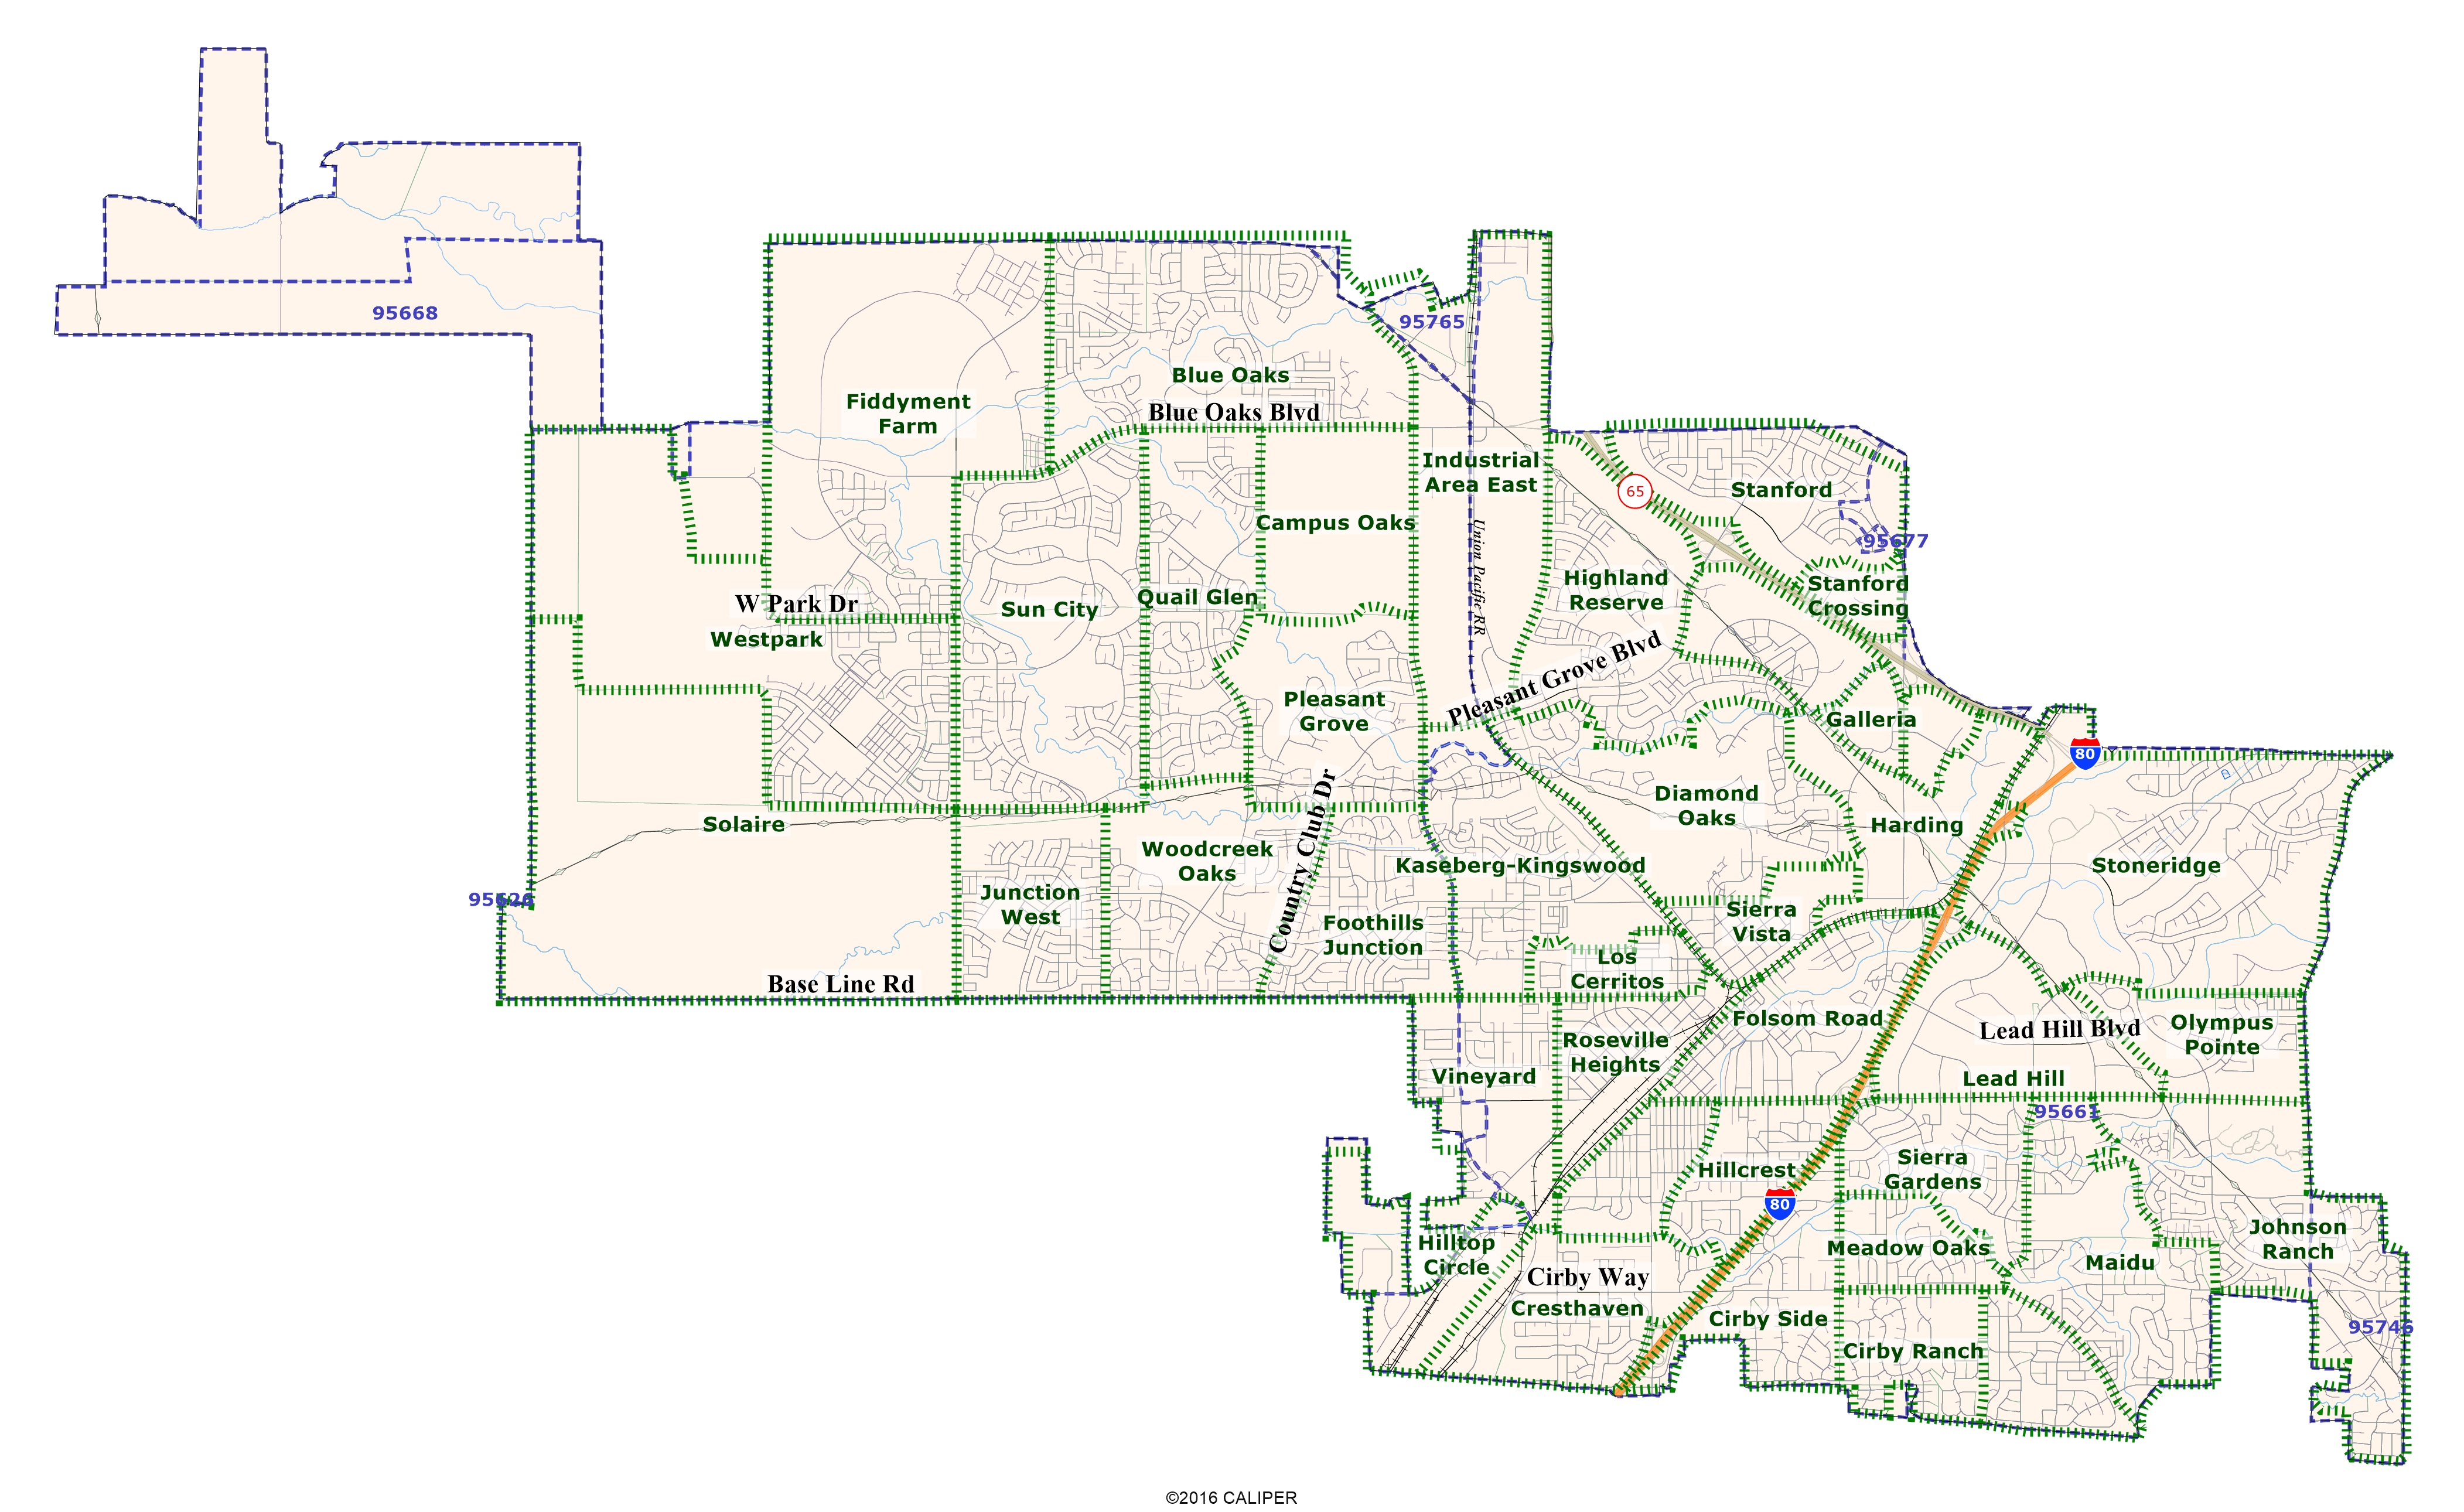
- Map of official neighborhood associations in the city
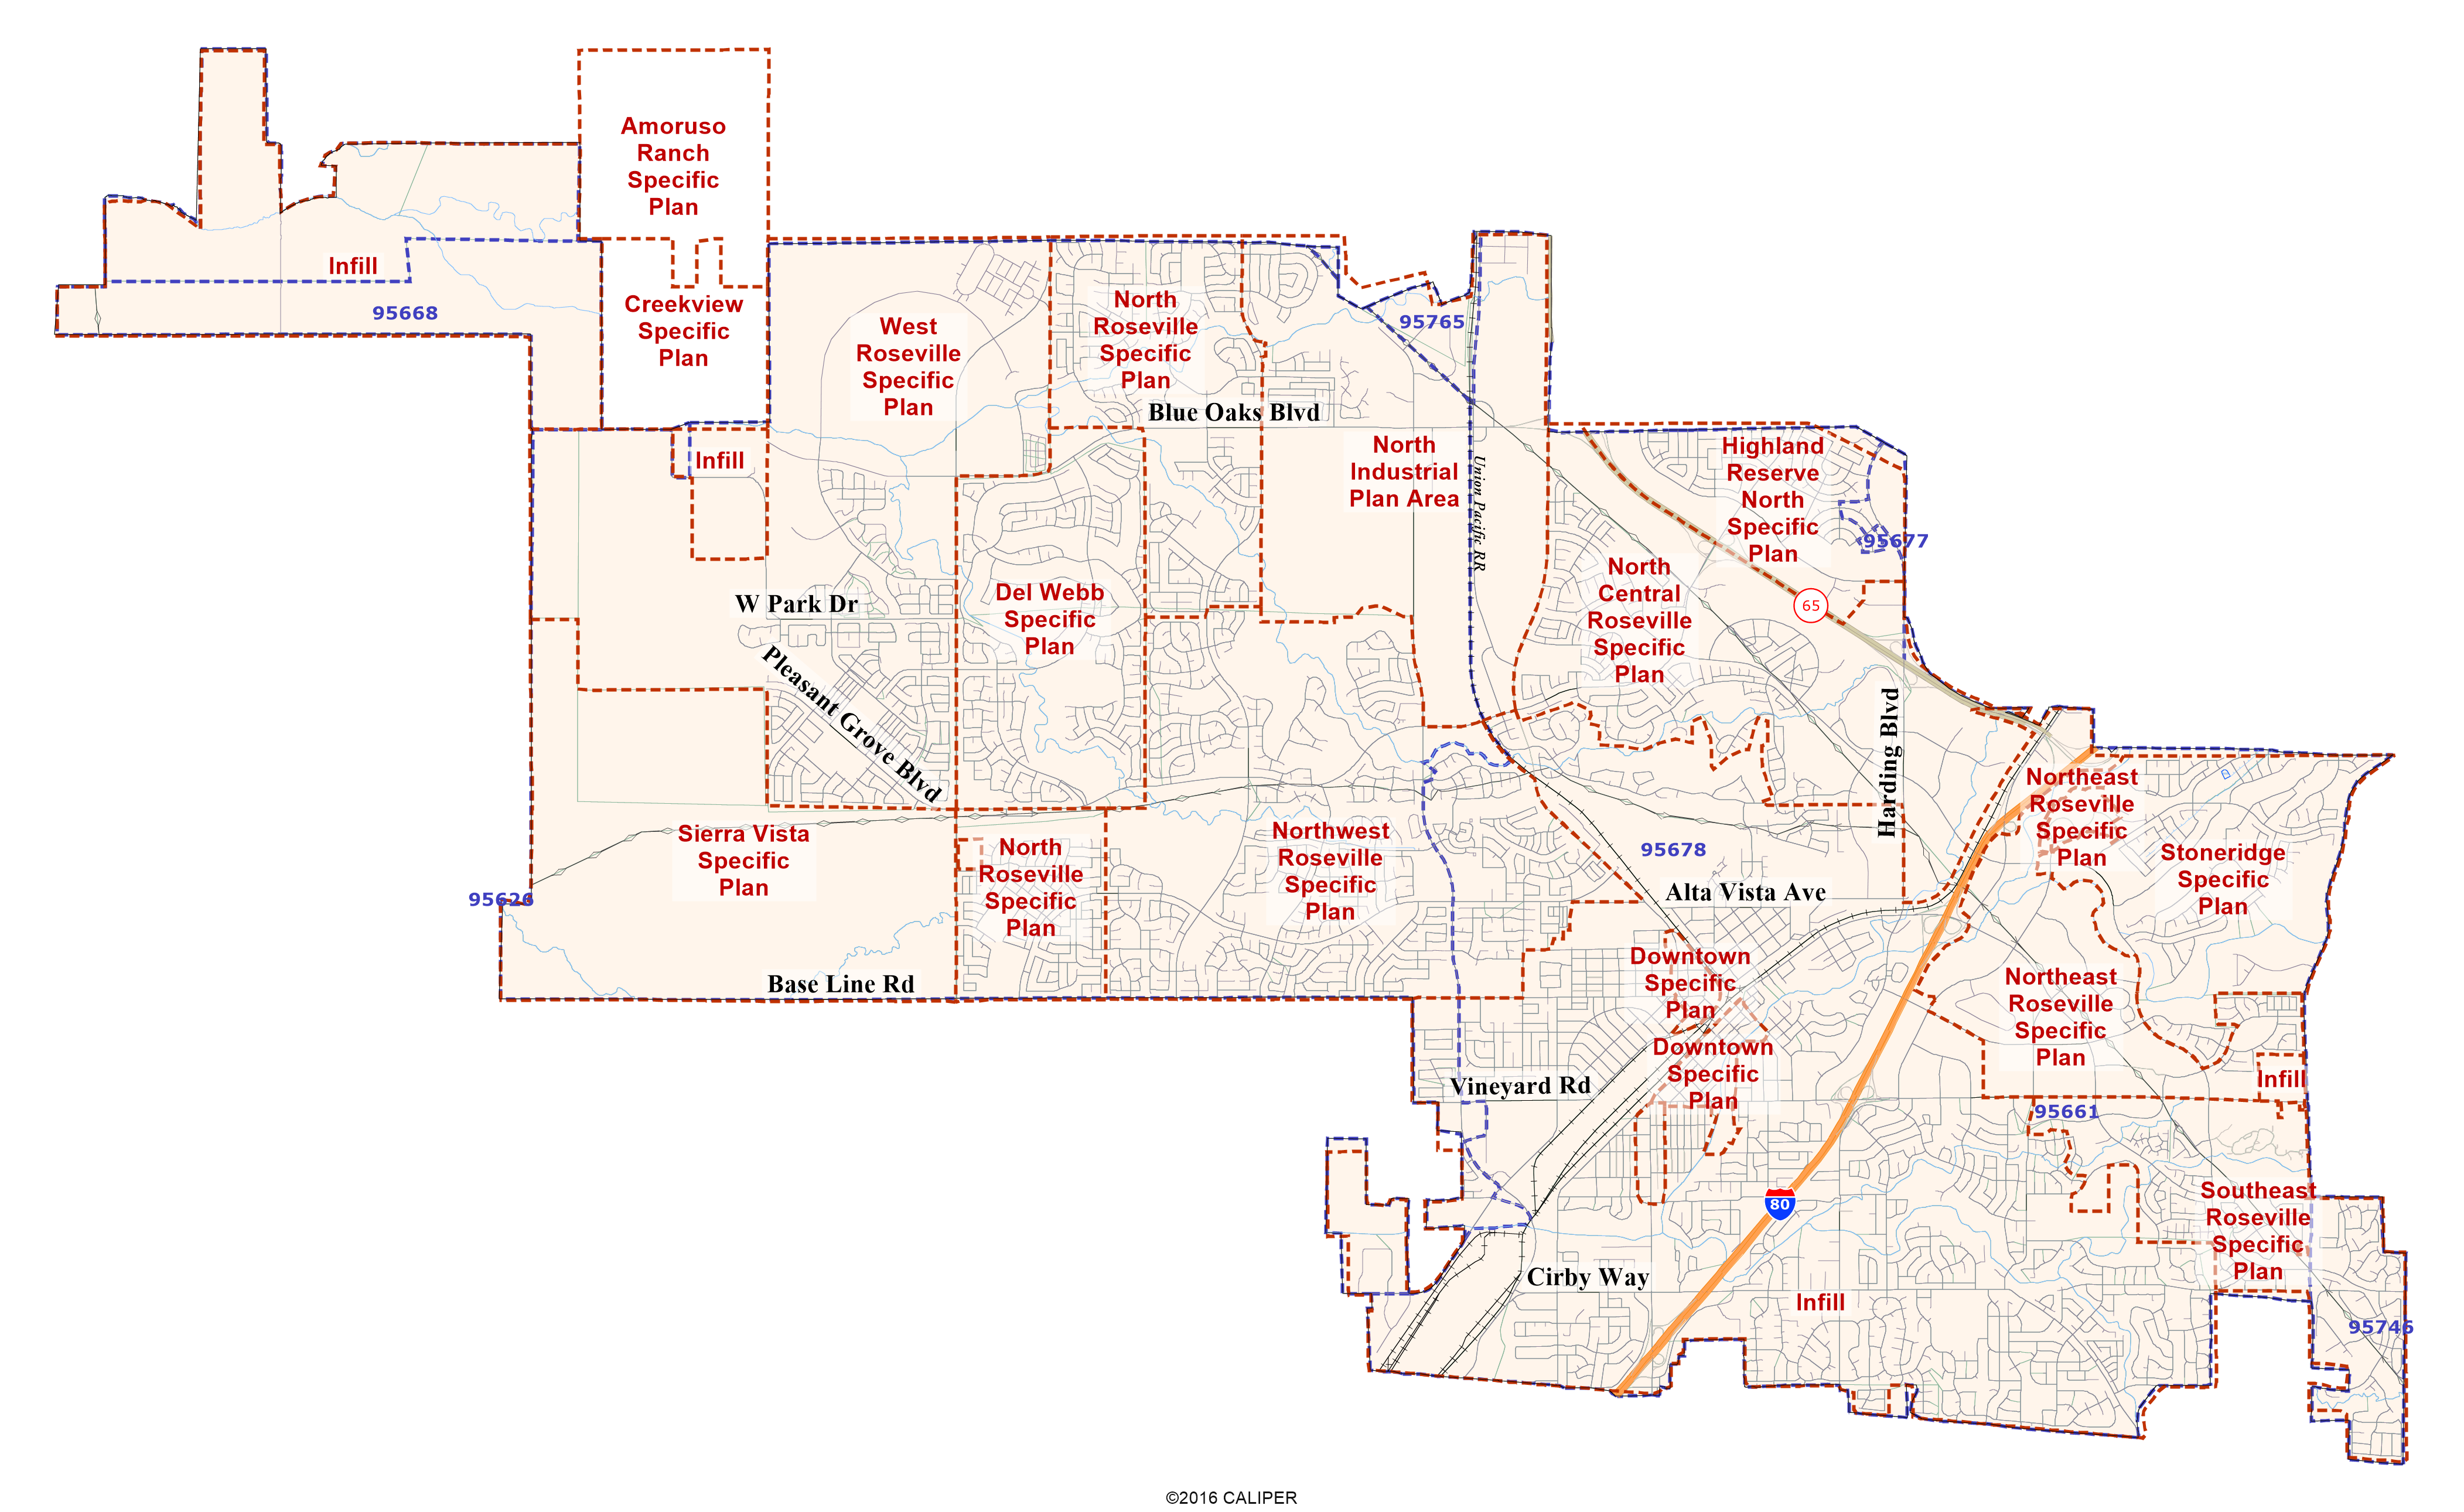
- Official map of subdivisions in the city
Microsoft Excel Supplement
Are you familiar with the basic functions of Microsoft Excel? Then you can let Excel do the total population and demographic math for you. First, download and save the Excel file to your computer. Then use the Excel file and the Map of Population Unit ID numbers (either the PDF map or the online interactive map) to assign the Population Units to your desired districts. Excel will provide the resulting demographics for each district.
5-District Excel file English version or Spanish version.
Interactive Public Participation Kit Supplement
If you want to see exactly where the various Population Unit boundaries are located, or if you have difficulty reading the small print on the 8.5×11 PDF files, you can use this interactive map to zoom in and out on the Population Unit boundaries, and switch back and forth between PopUnit ID number labels and total population labels.. It works like Google Maps, except you use check-boxes to choose what layers and labels you want to see on the map. (Once they are released, the Draft Maps will also appear as layer options on this same map.)
Online Districting Tool
The most powerful map-drawing tool, but also the most difficult to use, is the online districting tool. This tool enables you to draw districts Census Block by Census Block, just like the professional demographers. You can fine-tune your district lines and see, in detail, the resulting demographics as you draw your map.
But with this power comes complexity: this tool can be challenging to figure out at first. So before you log in, be sure to review the following helpful guides:
- A series of short, 90 to 120 second, training videos
- An in-depth 15 minute training video
- Quick Start Guide in English or en Español
- One-Page tool reference sheet in English and in en Español